Your building is heating itself right now. Nobody is there. The lifts are parked, the cleaning crew has gone, the security desk is dark, and the air-handling unit on the third floor is pulling fresh air at full speed.
This is the 3am problem. It is the single most expensive habit a commercial building has, and it almost never shows up on the operations report because nobody is watching at 3am.
What happens when the lights go off
Buildings rarely stop. Heating set points, ventilation rates and chilled-water flow keep running under whatever schedule was set during commissioning. The schedule made sense when the building was full, on a different tenancy, with a different operating pattern. Five years on, the schedule is still doing exactly what it was told.
The same pattern repeats across the portfolios we monitor. A school estate sees boilers fire at 04:00 on a Saturday because a one-off weekend event was never removed. A corporate office runs its AHUs at 60% through the night because a demand-control setting was switched off during a CO₂ sensor fault and never switched back on. A higher-education campus heats a lecture theatre to 21°C through Reading Week.
The numbers in isolation look small. Stitched together, they become between 20% and 40% of the annual bill.
The BMS was right five years ago
Most commercial Building Management Systems were configured when the building opened. The engineer who tuned the set points, schedules and overrides has often moved on. The records of why a particular damper is locked open sit in someone’s archived inbox.
Meanwhile, the building itself has changed. Tenant mix, hours of use, equipment loads, the climate outside. All of it different. The BMS is doing yesterday’s job for tomorrow’s building, and nobody on the estates team has time to audit a thousand control points to find the gap.
This is not a vendor failing. It is a maintenance gap that every commercial estate carries. The BMS was right five years ago.
Why a dashboard will not find it
Most energy software adds a layer of charts on top of the data the meters already produce. The colours are pretty. The PDFs land on the FM’s desk. The waste keeps happening.
A dashboard tells you what the building did. It does not tell you which 30 minutes to attack first, which control point is the cause, or what the FM should ask the BMS contractor to change on Monday morning. The diagnosis is left to the human.
The FM team is already at capacity. There is a national shortage of BMS engineers. Asking another professional to sit and read charts is the wrong intervention.
The fix: ranked actions, not more data
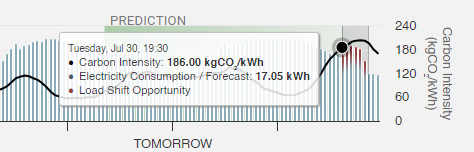
The 3am problem disappears when three things line up. First, the data has to be high-resolution and complete. Half-hourly across every meter and sensor on the building. Second, the analysis has to compare what the building did against what it should have done, given occupancy, weather and tariff. Third, the output has to be a ranked list of plain-English actions, in priority order, that an FM can hand to a BMS contractor and tick off.
That is what expert-guided AI is for. The building tells the platform what it did. The platform tells the team what to fix and why. The team signs off and implements. The savings show up in the next bill. The FM stays in control. Always.
A worked example
A corporate office in our portfolio looked normal on paper. The BMS reported no faults. The energy invoices were within historical range. The half-hourly data told a different story.
AHU-3 was pulling fresh air at full speed every night between 22:00 and 06:00 because a CO₂ override had been set during a 2022 commissioning visit and never removed. The out-of-hours load on that single unit was £4,720 a month.
That was one of seventeen ranked actions on the site. Across the year, the building cut 49% of its energy spend. £163,000 reclaimed, 439 tonnes of CO₂e gone, with no capex, no new plant, and no impact on occupant comfort.
GridEdge is one of the best investments we’ve made to date.
What to do on Monday morning
The 3am problem is solvable without a procurement cycle. Three steps for the FM team.
- Pull a clean half-hourly export from each meter for the last 14 months. The data already exists. Plot the overnight load against the day load. The gap is the budget you have to play with.
- Audit the BMS schedules and overrides for any setting older than 18 months. Half of them will be doing yesterday’s job.
- Ask the question your building can actually answer: which 30 minutes cost the most last month, and which control point caused it?
Your building has been talking for years. Most estates are not listening hard enough. Comfort, cost, carbon, in that order, all hinge on the half-hour you cannot see from the lobby.
See your building.
Sources
- UK grid carbon intensity dashboard, National Energy System Operator: neso.energy
- Customer feedback quote: GridEdge customer questionnaire (Nathan Millington, Consilium Academies, January 2026).
-1.png)