
Book a demo

Visualise · see it

Every building. Every half hour.

Send us an energy bill and see your own data. Free to start.

The problem

A monthly bill can’t show which building is wasting energy.

Half-hourly data shows which buildings run well and where to look deeper. Optimise then tells you why.

What you see

Every building on one page, worst first.

Energy, cost and carbon for your own buildings, plus live carbon from the grid. Not a sales demo.
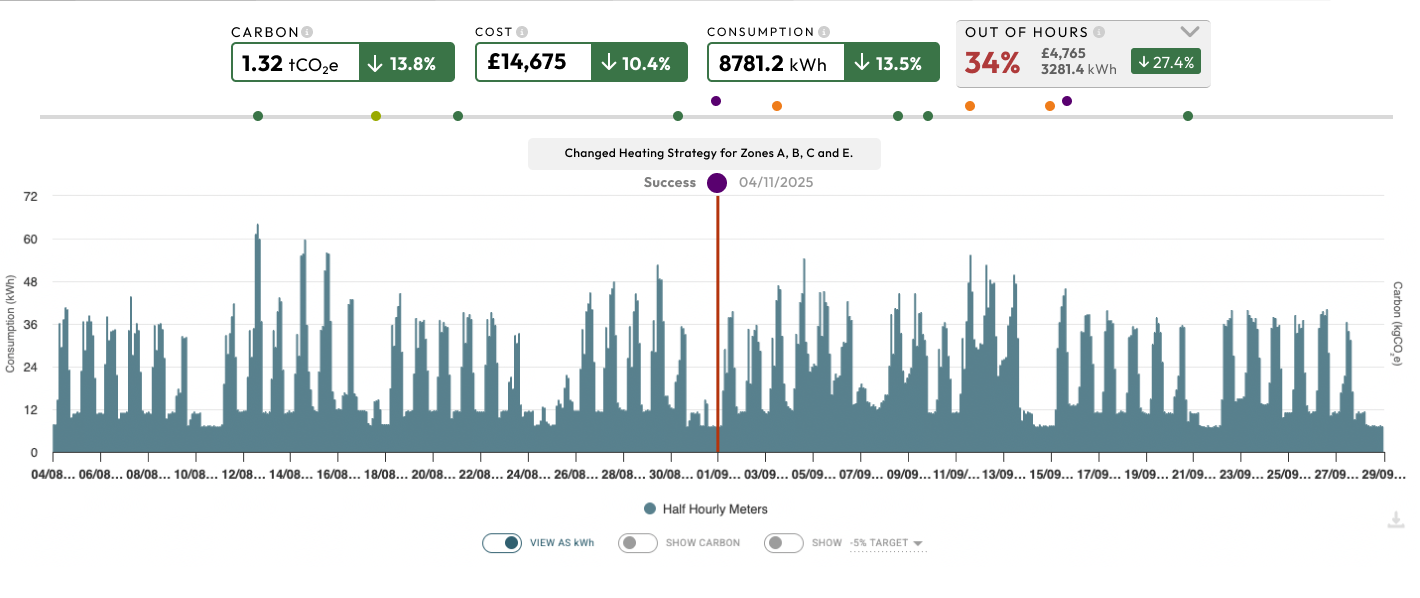
Energy Tracker: cost, carbon and out-of-hours tiles above a half-hourly energy chart
Half-hourlyEvery meter, every half hour
14 monthsOf history, pulled for you
No hardwareMeter data only, to start

How to start

Three steps. About two minutes from you.

  1. 1

    Send us an energy bill

    We take the meter numbers from it. Then a quick form to approve them.

  2. 2

    We pull your history

    Ready within 48 hours.

  3. 3

    We walk you through it

    Your own buildings on screen, and the first things worth a look.

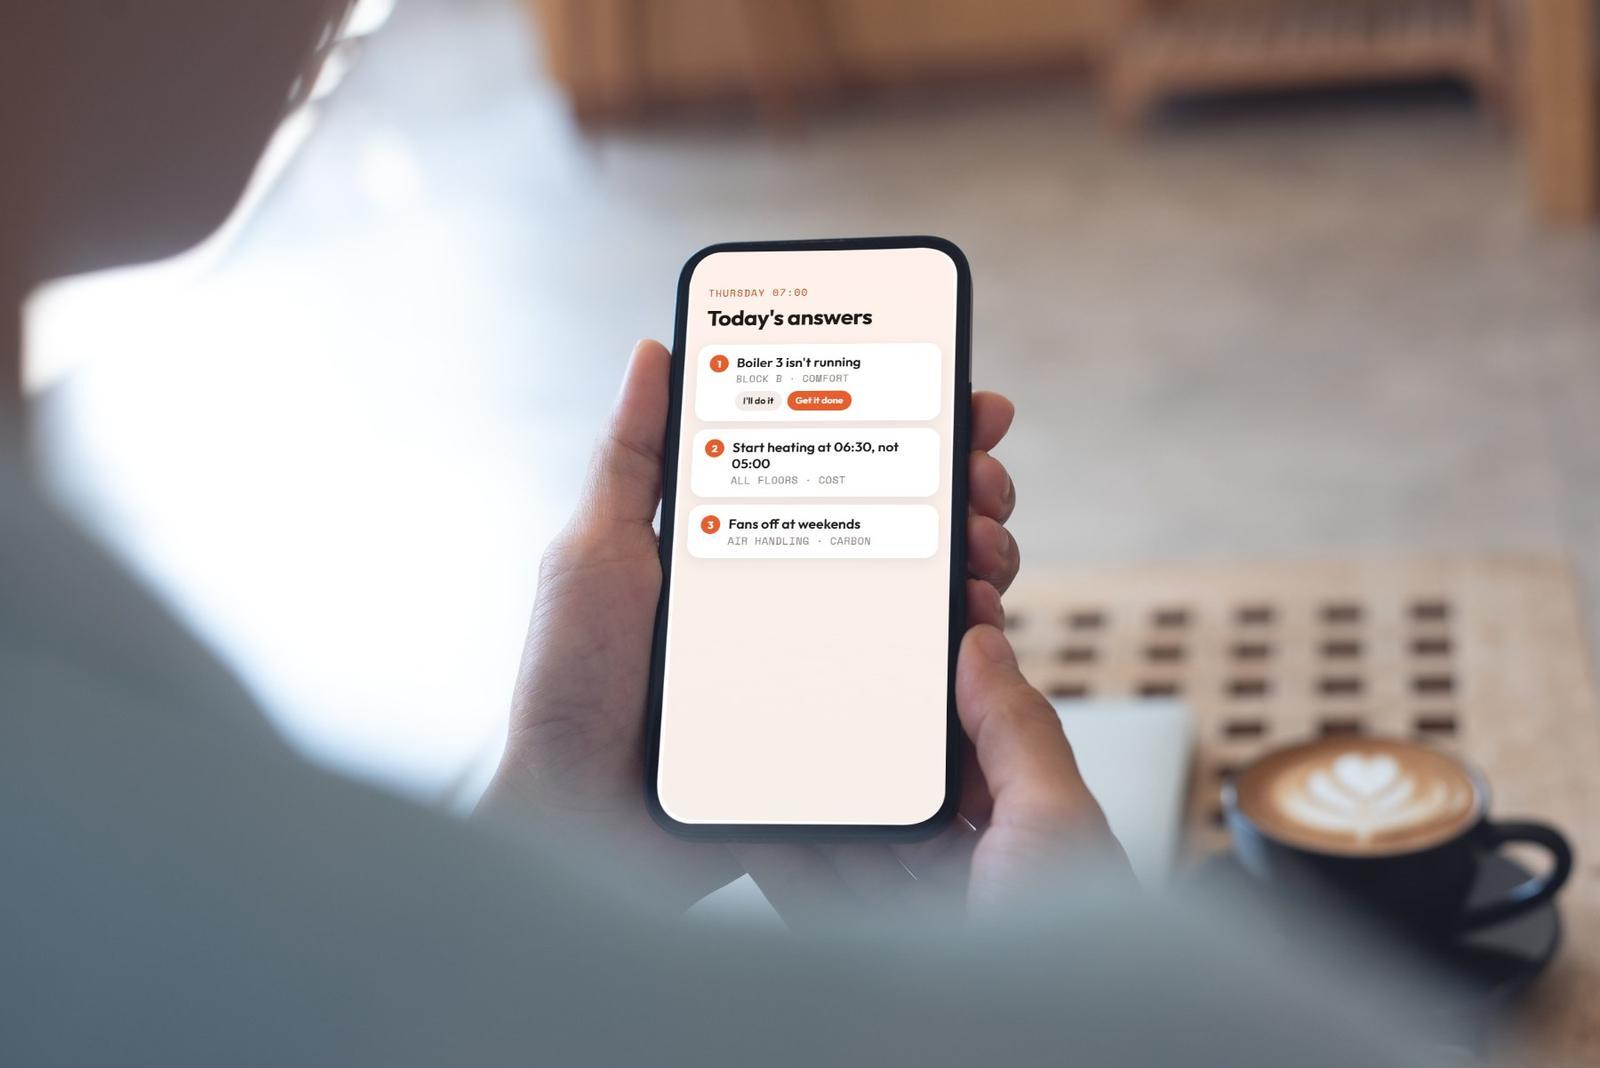
A phone showing today’s top actions from GridEdge

Then

Seeing it is step one. Fixing it is step two.

Connect your heating controls and the top three arrive every morning.

Optimise: fix it

See if your building could save energy.

Six quick questions, then a free report on your last 14 months. No commitment.

See if your building could save energy

About a minute. Nothing is sent unless you choose.